A weather app says “30% chance of rain.” A lottery ad says “1 in 292 million.” A friend says the odds are “three to one.” All three describe how likely something is, but they use different scales, and mixing them up is where most mistakes start.
Understanding probability means using one formula: wanted outcomes divided by all equally likely outcomes. This guide shows you how that formula works, how to turn probability into odds and back, and which rule to use when a question has “and,” “or,” or “at least one” in it.
You will work through dice, cards, a raffle, and real lottery and weather figures. Each step uses plain arithmetic, so a calculator is all you need.
Quick answer: Probability is the chance that an event happens, written from 0 (impossible) to 1 (certain). Divide the outcomes you want by the total number of equally likely outcomes. Odds compare the outcomes you want to the ones you do not, so a probability of 1 in 4 equals odds of 1 to 3.
Key takeaways
- Probability = wanted outcomes ÷ all equally likely outcomes, and it always falls between 0 and 1.
- Odds compare wanted to unwanted outcomes, so odds of 1 to 3 in favor equal a 25% probability.
- For “at least one” questions, find the chance of none and subtract it from 1.
- “And” with independent events means multiply. “Or” with no overlap means add.
- Short streaks prove nothing. Real results only settle near the math after many trials.
What Is Probability?
Probability is a number that measures how likely an event is. An event is the result, or group of results, you care about, such as rolling a 4 or drawing a heart. The list of every possible result is called the sample space.
Probabilities sit on a scale from 0 to 1. You can write them as fractions, decimals, or percentages, and each form means the same thing.
| Probability | Percent | What it means | Example |
|---|---|---|---|
| 0 | 0% | Impossible | Rolling a 7 on one standard die |
| 0.25 | 25% | Unlikely | Drawing a heart from a 52-card deck (13 of 52) |
| 0.5 | 50% | Even chance | Heads on a fair coin |
| 0.75 | 75% | Likely | Not drawing a heart (39 of 52) |
| 1 | 100% | Certain | Rolling 1 to 6 on a standard die |
If fractions or percentages feel shaky, a quick look at how percentages work in real life makes the conversions below much easier.
How Do You Calculate Probability?
You calculate probability by dividing the number of favorable outcomes by the total number of equally likely outcomes.
P(A) = number of favorable outcomes ÷ total number of equally likely outcomes
The phrase “equally likely” matters. The formula works for a fair die, a shuffled deck, or a fair coin. It fails for a loaded die or a spinner with unequal sections, because the outcomes no longer have the same chance.
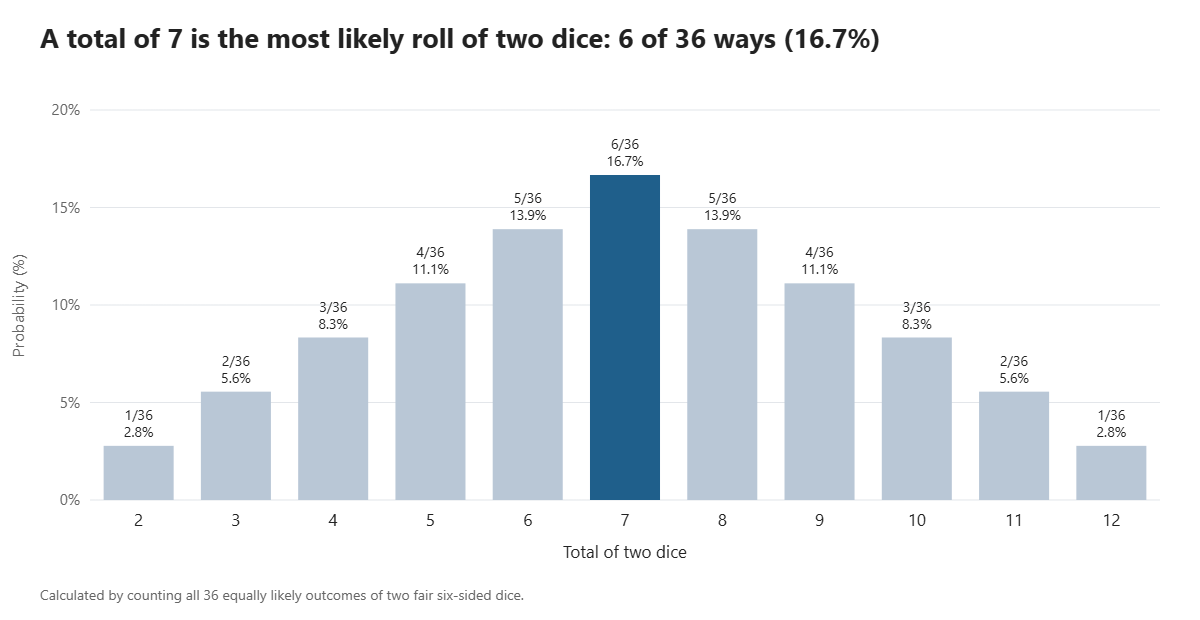
The result is a fraction, so a fraction calculator is handy for simplifying it. Here is the formula in action on a question people often get wrong: what is the chance that two dice add up to 7?
Step 1: List the sample space
Each die has 6 faces, so two dice give 6 × 6 = 36 equally likely outcomes. (Count (1,2) and (2,1) as different outcomes, because the dice are separate.)
Step 2: Count the favorable outcomes
Totals of 7 come from (1,6), (2,5), (3,4), (4,3), (5,2), and (6,1). That is 6 outcomes.
Step 3: Divide
P(sum of 7) = 6 ÷ 36 = 1/6, which is about 16.67%.
Totals are not equally likely, even though each die is fair. A 2 can only come from (1,1), so it has just 1 of 36 outcomes. A 7 has the most routes of any total, which is why it is the most common roll.
What Is the Difference Between Probability and Odds?
Probability compares the outcomes you want to all outcomes, while odds compare the outcomes you want to the outcomes you do not. That one change in the denominator is the whole difference.
Odds in favor are written as wanted : unwanted. Odds against flip the order. If you are comfortable with ratios and proportions, odds are simply a ratio of two counts.
| Event | Probability | Odds in favor | Odds against |
|---|---|---|---|
| Heads on a fair coin | 1/2 = 50% | 1 : 1 | 1 : 1 |
| Rolling a 6 on one die | 1/6 ≈ 16.7% | 1 : 5 | 5 : 1 |
| Drawing a heart | 13/52 = 25% | 1 : 3 | 3 : 1 |
| Drawing a face card (J, Q, K) | 12/52 ≈ 23.1% | 3 : 10 | 10 : 3 |
Check the direction before you trust a number. “Odds of 3 to 1” could mean three chances for and one against, or the reverse, and plenty of sports and gaming sites use “odds” for payout ratios instead. When it matters, ask which side the first number belongs to.
Mathwords defines odds in favor and odds against the same way as the table above, and it gives the same conversion formula used below.
How do you convert odds to probability and back?
Use these two formulas. Here p is the probability and “odds” is the odds in favor written as a single number (wanted ÷ unwanted).
odds = p ÷ (1 − p) p = odds ÷ (1 + odds)
If odds are written as a : b, the shortcut is p = a ÷ (a + b). Odds of 2 : 3 give 2 ÷ 5 = 0.4, or 40%.
Here is a conversion ladder you can scan instead of recalculating each time.
| Probability | Percent | Odds as a number | Odds in favor |
|---|---|---|---|
| 0.10 | 10% | 0.111 | 1 : 9 |
| 0.25 | 25% | 0.333 | 1 : 3 |
| 0.50 | 50% | 1 | 1 : 1 |
| 0.75 | 75% | 3 | 3 : 1 |
| 0.90 | 90% | 9 | 9 : 1 |
| 0.95 | 95% | 19 | 19 : 1 |
| 0.99 | 99% | 99 | 99 : 1 |
Look at the bottom rows. Going from 90% to 99% looks like a small step, but the odds jump from 9 to 99. Near certainty, odds stretch out fast, which is why odds feel so different from percentages.
Which Probability Rule Should You Use?
Pick the rule from the key word in the question: “not” or “at least one” means subtract from 1, “or” means add, and “and” means multiply. The table below pairs each wording with its rule and a checked example.
| Question wording | Rule | Formula | Example |
|---|---|---|---|
| “Not A” or “at least one” | Complement | P(not A) = 1 − P(A) | Rain on neither of two 30% days: 0.7 × 0.7 = 0.49, so rain at least once = 1 − 0.49 = 0.51 |
| “A or B,” cannot both happen | Add | P(A) + P(B) | Rolling a 1 or a 2: 1/6 + 1/6 = 1/3 |
| “A or B,” can both happen | Add, then subtract the overlap | P(A) + P(B) − P(A and B) | 30 students, 12 play soccer, 10 play chess, 4 do both: (12 + 10 − 4) ÷ 30 = 0.6 |
| “A and B,” independent | Multiply | P(A) × P(B) | Six heads in a row: (1/2)^6 = 1/64 |
| “A and B,” first changes second | Multiply with the updated chance | P(A) × P(B given A) | Two aces without replacement: 4/52 × 3/51 = 1/221 ≈ 0.45% |
Two ideas sit behind the last two rows. Events are independent when one result does not change the other, like two separate coin flips. They are dependent when it does, like drawing cards without putting them back, because the deck is smaller and different for the second draw.
The complement rule is the most useful one for beginners. A question like “what is the chance of at least one 6 in four rolls?” looks like it needs many cases. Flip it: the chance of no 6 in four rolls is (5/6)^4 ≈ 0.482, so at least one 6 has probability 1 − 0.482 ≈ 0.518, about 51.8%.
Worked Example: The Raffle “At Least One” Problem
Say a school raffle sells 200 tickets and draws 5 winners, and a ticket cannot win twice. You bought 3 tickets. What is the chance that at least one of your tickets wins, and what are the odds?
Step 1: Pick the easier question
“At least one wins” has many cases (one ticket wins, two win, all three win). “None of mine win” has just one. Solve that one and subtract.
Step 2: Multiply the chance that each ticket loses
There are 200 tickets and 5 winners, so 195 are losers. Your first ticket loses with probability 195/200. If it did, your second loses with probability 194/199, and your third with 193/198. These are dependent events, so the fractions update as you go.
P(none win) = 195/200 × 194/199 × 193/198 ≈ 0.9265
Step 3: Subtract from 1
P(at least one wins) = 1 − 0.9265 = 0.0735, about 7.35%.
Step 4: Convert to odds
Odds in favor = 0.0735 ÷ 0.9265 ≈ 0.0793, which is about 1 to 12.6. Put differently, the odds against you are about 12.6 to 1.
A tempting shortcut is 3 tickets × 5 winners ÷ 200 = 7.5%. It lands close, but it is not exact, because adding chances for events that can overlap counts some outcomes twice. The complement method gives the true figure.
What Is the Difference Between Theoretical and Experimental Probability?
Theoretical probability comes from the math of equally likely outcomes, while experimental probability comes from what actually happened in a set of trials. For a fair coin, the theoretical chance of heads is 1/2. If you flip it 20 times and see 13 heads, the experimental probability is 13/20 = 65%.
Those two numbers rarely match in a short run. The law of large numbers says the experimental result tends to move toward the theoretical one as trials pile up. Ten flips can easily give 7 heads without anything strange going on. Ten thousand flips would stay much closer to 50%.
Even “obvious” probabilities hold small surprises. A 2023 study that analyzed 350,757 coin flips found that fair coins landed on the side they started on about 50.8% of the time, roughly 8 extra same-side landings per 1,000 flips, according to the researchers’ arXiv paper on coin flips.
That bias is far too small to matter for settling who goes first, which is a good reminder that the 50-50 model is an excellent working approximation, not a law of nature.
Where Do You See Probability in Real Life?
Weather forecasts and lotteries are two places where the same formula shows up under different wording.
A “40% chance of rain” does not mean it rains 40% of the time. The National Weather Service says forecasters reach the figure by multiplying their certainty that rain will form by the share of the area expected to get it. An 80% certainty over half the area gives 40%, and so does 100% coverage with 40% certainty.
The National Weather Service explains this in its probability of precipitation guide.
Lottery numbers are counting problems. In Powerball, you choose 5 white balls from 69 and 1 red ball from 26. There are 11,238,513 ways to pick the 5 white balls, and multiplying by 26 gives 292,201,338 possible tickets. One ticket wins the jackpot, so the probability is 1 in 292,201,338.
Official figures are on the Powerball prize chart, which also lists the overall chance of winning any prize at about 1 in 24.87, or roughly 4.02%.
What Are the Most Common Probability Mistakes?
Most errors come from using the right formula on the wrong kind of event. Use this table to catch them before they cost you marks on a test.
| Mistake or myth | Reality |
|---|---|
| “After five heads, tails is due.” | A coin has no memory. The next flip is still 1/2, which is why this belief is called the gambler’s fallacy. |
| “Odds of 1 to 3 means 1/3.” | Odds of 1 to 3 mean 1 wanted for every 3 unwanted, so the probability is 1/4 = 25%. |
| “Two 30% rain days make 60%.” | The chance of rain at least once is 1 − 0.7 × 0.7 = 51%. |
| “All totals on two dice are equally likely.” | A total of 7 has 6 of 36 outcomes, while a total of 2 has only 1 of 36. |
| “Drawing a second card works like the first.” | Without replacement, the deck changes. Two aces in a row is 4/52 × 3/51, not 4/52 × 4/52. |
Frequently Asked Questions
What is the formula for probability?
The formula is P(A) = favorable outcomes ÷ total equally likely outcomes. For a standard die, the chance of rolling an even number is 3 ÷ 6 = 0.5. The answer always falls between 0 and 1, and you can write it as a fraction, decimal, or percentage depending on what the question asks for.
How do you convert odds to probability?
Add the two numbers in the odds, then divide the first by that total. Odds of 3 to 2 in favor give 3 ÷ (3 + 2) = 0.6, or 60%. If you have odds against, such as 3 to 2 against, flip them to 2 to 3 first, which gives 2 ÷ 5 = 40%.
What is the difference between probability and odds?
Probability compares wanted outcomes to all outcomes, so a coin flip is 1/2. Odds compare wanted outcomes to unwanted ones, so the same flip is 1 to 1. A probability of 25% is odds of 1 to 3 in favor. They describe the same chance, just on different scales.
How do you find the probability of at least one event?
Find the chance that the event never happens, then subtract it from 1. For at least one 6 in four die rolls, the chance of no 6 is (5/6)^4 ≈ 0.482. So at least one 6 has probability 1 − 0.482 ≈ 0.518. This shortcut avoids counting every separate case.
What does a 30% chance of rain mean?
It means that under conditions like today’s, the forecaster expects measurable rain at any given point in the forecast area about 30 times out of 100. The figure combines how sure the forecaster is that rain will form and how much of the area will get it. It does not describe how long it will rain.
Is probability the same as chance?
Yes, in everyday math “chance” and “probability” mean the same thing. A 1 in 5 chance, a probability of 0.2, and a 20% chance all describe one idea. Odds are the only common term that works differently, since odds compare wanted outcomes with unwanted ones instead of with all outcomes.
The Short Version
- Probability = favorable outcomes ÷ total equally likely outcomes, from 0 to 1.
- Odds = wanted : unwanted. Convert with p = odds ÷ (1 + odds).
- Use the complement (1 − P) whenever a question says “at least one.”
- Multiply for “and,” add for “or,” and subtract the overlap when both can happen.
- Small samples swing widely. Trust the math, then check it against many trials.
Ready to test yourself? Try the math quiz, use the percentage calculator to switch between decimals and percents, or browse more guides in the Mathematics category. For real figures to practice on, the Powerball prize chart is a good place to start.
Disclaimer
This article is for general educational purposes only. Probability describes long-run patterns, not guarantees about any single event, and nothing here is gambling or financial advice. For help with a specific course or exam, check with your teacher, tutor, or the official school requirements.